Monday, August 17, 2015

Finding concurrent calls per day from the Asterisk cdr database table.

Create the following procedure in MySQL where the cdr table is present. 
execute the procedure using the following command;

mysql> tee output.txt
To save the output into a test file
mysql> call concurrent;
This procedure will display the start date and end date for which the data is computed. 
it also displays the day and the maximum concurrent calls for that day.
mysql> tee off; 
To stop writing to the file.

Slightly slower version
delimiter $$
drop procedure if exists concurrent$$

create procedure `concurrent`()
BEGIN
    SET @start_date_global = date((select min(calldate) from cdr));
    SET @end_date_global = date((select max(calldate) from cdr ));
    select @start_date_global,@end_date_global;
    WHILE (@start_date_global <= @end_date_global) DO
       
        create temporary table if not exists one_day (index(calldate)) ENGINE=MEMORY AS (select * from cdr where date(calldate) = @start_date_global);
        SET @start_date = (select min(calldate) from one_day);
        SET @end_date = (select max(calldate) from one_day);
        SET @max_conc = 0;
        SET @max_conc_val =0;
--        select @start_date,@end_date;
         WHILE (@start_date <= @end_date) DO
            SET @max_conc_val = (select count(a.uniqueid) from one_day a where date(a.calldate) = date(@start_date) and @start_date between a.calldate and date_add(a.calldate,INTERVAL a.duration second) );
            IF (@max_conc_val > @max_conc) THEN
                SET @max_conc = @max_conc_val;
            END IF;
            SET @start_date = date_add(@start_date, INTERVAL 1 second);
--        select @start_date,@max_conc_val,@max_conc;
        END WHILE;
        select @start_date_global,@max_conc;
        SET @start_date_global = date_add(@start_date_global, INTERVAL 1 day);
        drop temporary table one_day;
    END WHILE;
END $$

delimiter ;

Faster Version

delimiter $$
drop procedure if exists fast_concurrent$$

create procedure `fast_concurrent`()
BEGIN
    SET @start_date_global = date((select min(calldate) from cdr));
    SET @end_date_global = date((select max(calldate) from cdr ));
    select @start_date_global,@end_date_global;
    create temporary table full_time(time_of_day time PRIMARY KEY, ct int) ENGINE=MEMORY;
    SET @start_of_day = '1990-01-01 00:00:00';
    SET @end_of_day = '1990-01-01 23:59:59';
    WHILE (@start_of_day <= @end_of_day) DO
        INSERT INTO full_time values (time(@start_of_day),0);
        SET @start_of_day = date_add(@start_of_day, INTERVAL 1 second);
    END WHILE;
--    select 'full time table built' as result1;   
    WHILE (@start_date_global <= @end_date_global) DO
        create temporary table if not exists one_day (index(calldate)) ENGINE=MEMORY AS (select * from cdr where date(calldate) = @start_date_global);
        SET @row_ct = (select count(*) from one_day);
        SET @row_iter = 1;
        BLOCK2: BEGIN
            DECLARE start_date DATETIME;
            DECLARE end_date DATETIME;
            DECLARE cur_row_iter cursor for select calldate,date_add(calldate,INTERVAL duration second) from one_day;
            open cur_row_iter;
            WHILE (@row_iter <= @row_ct) DO
                FETCH cur_row_iter into start_date,end_date;
                update full_time set ct=ct+1 where time_of_day between time(start_date) and time(end_date);
                SET @row_iter=@row_iter +1;
--                select 'updating row', @row_iter,@row_ct;
            END WHILE;
        END BLOCK2;
        SET @max_conc = (select max(ct) from full_time);
        select @start_date_global,@max_conc;
        update full_time set ct=0;
        SET @start_date_global = date_add(@start_date_global, INTERVAL 1 day);
        drop temporary table one_day;
    END WHILE;
    drop temporary table full_time;
END $$

delimiter ;


Example output
mysql> call concurrent();
+--------------------+------------------+
| @start_date_global | @end_date_global |
+--------------------+------------------+
| 2015-07-01         | 2015-08-13       |
+--------------------+------------------+
1 row in set (1.55 sec)

+--------------------+-----------+
| @start_date_global | @max_conc |
+--------------------+-----------+
| 2015-07-01         |        39 |
+--------------------+-----------+
1 row in set (5 min 56.72 sec)

+--------------------+-----------+
| @start_date_global | @max_conc |
+--------------------+-----------+
| 2015-07-02         |        37 |
+--------------------+-----------+
1 row in set (11 min 36.81 sec)

+--------------------+-----------+
| @start_date_global | @max_conc |
+--------------------+-----------+
| 2015-07-03         |         7 |
+--------------------+-----------+
1 row in set (12 min 11.05 sec)

+--------------------+-----------+
| @start_date_global | @max_conc |
+--------------------+-----------+
| 2015-07-04         |         3 |
+--------------------+-----------+
1 row in set (12 min 20.40 sec)

+--------------------+-----------+
| @start_date_global | @max_conc |
+--------------------+-----------+
| 2015-07-05         |         2 |
+--------------------+-----------+
1 row in set (12 min 29.21 sec)

+--------------------+-----------+
| @start_date_global | @max_conc |
+--------------------+-----------+
| 2015-07-06         |        27 |
+--------------------+-----------+
1 row in set (17 min 59.58 sec)

+--------------------+-----------+
| @start_date_global | @max_conc |
+--------------------+-----------+
| 2015-07-07         |        57 |
+--------------------+-----------+
1 row in set (25 min 43.06 sec)
 As you can see depending on the data the calculation is going to take a long time. If anyone improves on this please comment so that every one can benefit. Also depending on need the output can be written into another table so that you can use it for future and not have to calculate every time. 
Another use case is run this for just one day every day and write the output to a table so when you need it you can just look at the stored table. 
If you want to just compute this for a filtered data just add the filter in the temporary table creation script and that should work.

Sunday, August 17, 2014

Using Logstash to process nagios performance data and sending it to Graphite

Nagios is a very powerful tool that lets you monitor various parts of your infrastructure. It collects a lot of information which can be used to learn more about your infrastructure.

Logstash is a tool to process / pipe all types of events and logs. There are many output filters for this tool one of which is graphite.

I have found it difficult to find specific examples on doing just this by googling. So I thought I will put my results here so that it might help other to adopt these tools easily.

The Nagios Section

The nagios specific configurations that I have done to process performance data that nagios monitors is.

process_performance_data=1

host_perfdata_command=process-host-perfdata
service_perfdata_command=process-service-perfdata


host_perfdata_file=/var/log/nagios/host-perfdata
service_perfdata_file=/var/log/nagios/service-perfdata

host_perfdata_file_template=[HOSTPERFDATA]\t$TIMET$\t$HOSTNAME$\t$HOSTEXECUTIONTIME$\t$HOSTOUTPUT$\t$HOSTPERFDATA$
service_perfdata_file_template=[SERVICEPERFDATA]\t$TIMET$\t$HOSTNAME$\t$SERVICEDESC$\t$SERVICEEXECUTIONTIME$\t$SERVICELATENCY$\t$SERVICEOUTPUT$\t$SERVICEPERFDATA$


These settings enable nagios to process the services and hosts performance data. It creates /var/log/nagios/service-perfdata.out file with data described in the template.

A sample Current Load service will look like

1408303233      localhost       Current Load    OK      1       HARD    0.004   0.103   OK - load average: 0.59, 0.51, 0.54     load1=0.590;5.000;10.000;0; load5=0.510;4.000;6.000;0; load15=0.540;3.000;4.000;0;

We can use logstash to pick up this data process them into various fields and send the appropriate fields to graphite.

The LogStash Section
An example logstash configuration will look like

input {
        file {
                type => "serviceperf"
                path => "/var/log/nagios/service-perfdata.out"
        }
}
filter {
        if [type] == "serviceperf" {
                grok {
                        match => [ "message" , "%{NUMBER:timestamp}\t%{HOST:server}\tCurrent Load\t%{WORD:state}\t%{GREEDYDATA} load average: %{NUMBER:load_avg_1m}, %{NUMBER:load_avg_5m}, %{NUMBER:load_avg_15m}"]
                        add_tag => ["cpu"]
                }
                date {
                        match => [ "timestamp", "UNIX" ]
                }
        }
}
output {
        if  "cpu" in [tags] {
                graphite {
                        host => "localhost"
                        port => 2003
                        metrics => [ "%{server}.load_avg_1m","%{load_avg_1m}",
                                "%{server}.load_avg_5m","%{load_avg_5m}",
                                "%{server}.load_avg_15m","%{load_avg_15m}"]
                        }
        }
}


The configuration has 3 sections the
1. The input section will process the data that is generated by nagios.
2. Filter section will match and convert the plain row of text to a json format with key value pairs and we can use these fields to capture the desired values.
3. Output section send the output through carbon cache to graphite with the names of server and the captured values.

I am not including any setup of individual components in this blog post as each of them could be a whole another post. If I get some comments about questions I might write about that.

A good tool I used to get to grok filter definitions is Grok debugger. Basically you put in the line you want to process and you can start building the filter that meets your needs. I in this example wanted to extract the load average fields from the nagios check and plot them through graphite which looks the the image below.

Sample graphite graph
I will try to write about how to setup each component in the future.

Sunday, February 9, 2014

Two node PBX In A Flash (PIAF) Cluster using heartbeat and drbd

Install elrepo and epel on pbxin a flash both nodes.

# wget http://epel.mirror.freedomvoice.com/6/i386/epel-release-6-8.noarch.rpm
# yum install epel-release-6-8.noarch.rpm

# wget http://www.elrepo.org/elrepo-release-6-5.el6.elrepo.noarch.rpm
# yum install elrepo-release-6-5.el6.elrepo.noarch.rpm

Install DRBD

# yum install kmod-drbd83 drbd83-utils

Install heartbeat

# yum install heartbeat

Assuming the disk /dev/sdb is the one on both nodes to be mirrored.

create the file /etc/drbd.d/disk1.res with the following contents

resource disk1
{
startup {
wfc-timeout 30;
outdated-wfc-timeout 20;
degr-wfc-timeout 30;
}
net {
cram-hmac-alg sha1;
shared-secret sync_disk;
}
syncer {
rate 100M;
verify-alg sha1;
}
on node1 {
device /dev/drbd0;
disk /dev/sdb;
address ip-of-node1:7789;
meta-disk internal;
}
on node2 {
device /dev/drbd0;
disk /dev/sdb;
address ip-of-node2:7789;
meta-disk internal;
}
}


Create meta disk

#drbdadm create-md disk1


#service drbd start

On Node you want to make primary in this case node1
drbdadm -- --overwrite-data-of-peer primary disk1
To monitor the sync you can use
# watch "cat /proc/drbd"

Once the disk are synced  you should see something like this in
/proc/drbd

version: 8.3.16 (api:88/proto:86-97)
GIT-hash: a798fa7e274428a357657fb52f0ecf40192c1985 build by phil@Build32R6, 2013-09-27 15:59:12
 0: cs:Connected ro:Primary/Secondary ds:UpToDate/UpToDate C r-----
    ns:144600 nr:428 dw:145028 dr:32986 al:47 bm:0 lo:0 pe:0 ua:0 ap:0 ep:1 wo:f oos:0


Now make filesystem
# mkfs.ext4 /dev/drbd0

For some reason heartbeat does not work on ucast so I used mcast. Create your heartbeat configuration in /etc/ha.d/ha.cf as follows
debugfile /var/log/ha-debug
logfile /var/log/ha-log
logfacility local0
keepalive 300ms
deadtime 4
warntime 2
initdead 10
udpport 694
mcast eth0 239.1.2.3 694 1 0
#bcast eth0
auto_failback on
node node1 node2


Create haresource file
# cat /etc/ha.d/haresources
node1 drbddisk::disk1 Filesystem::/dev/drbd0::/disk1::ext4 mysqld
node1 cluster-ip/24/eth0/cluster-ip-broadcast-ip IPsrcaddr::cluster-ip asterisk httpd


Explanation
The first line is to make primary the drbd disk and mount it on the primary node and start MySQL
The 2nd line is to create a cluster-IP and send all outbound traffic through it and start asterisk (using amportal) and httpd.

Create authkeys file with permission 600 on both nodes
# dd if=/dev/urandom count=4 2>/dev/null | md5sum | cut -c1-32

# cat > /etc/ha.d/authkeys
auth 1
1 sha1

Create symlinks to mysqld and asterisk in /etc/ha.d/resources.d
# cd /etc/ha.d/resources.d
# ln -s /etc/init.d/mysqld
# ln -s /usr/local/sbin/amportal asterisk


Create a folder /disk1 so that when you start heartbeat the drbd disk is mounted
# mkdir /disk1

# service heartbeat start 


The above command will start mysqld asterisk and mount the drbd disk on /disk1


Stop mysqld and asterisk
Move /var/lib/mysql to /disk1/var/mysql
Move /var/lib/asterisk to /disk1/var/asterisk
Move /etc/asterisk to /disk1/etc/asterisk
Move /usr/lib/asterisk to /disk1/usr/asterisk
Move /tftpboot to /disk1/tftpboot
Move /var/spool/asterisk to /disk1/var/spool


on Node2 stop mysqld and asterisk
delete /var/lib/mysql /var/lib/asterisk /etc/asterisk /usr/lib/asterisk /tftpboot /var/spool/asterisk


Now create symlinks to the corresponding folders in disk1
example:
# cd /var/lib
# ln -s /disk1/var/mysql
# ln -s /disk1/var/asterisk
# cd /usr/lib
# ln -s /disk1/usr/asterisk
# cd /etc
# ln -s /disk1/etc/asterisk
# cd /
# ln -s /disk1/tftpboot
# cd /var/spool
# ln -s /disk1/var/spool/asterisk


If you have any other folders that need to be synced between two nodes just move them to the /disk1 and create symlinks on both nodes to point to it.

Disable mysqld and asterisk startup on boot using
# chkconfig mysqld off
# chkconfig asterisk off

Enable drbd to be started on boot on both nodes
# chkconfig drbd on

PIAF uses /etc/rc.local file to start asterisk so comment out the line  
/usr/local/sbin/amportal

Start heartbeat on second node. You have now a two node pbx in a flash cluster which works on the same database and same asterisk configuration. All you have to do is to use the cluster IP to manage the instance.

Thursday, January 16, 2014

Counting the total allocated disk space on a remote or local server.

If you are trying to count the total disk space allocated to a server local or remote the following would be useful

ssh user@server df -k | grep -v Filesystem|  awk '{print $2}' | paste -sd+ | bc 

the output will be total K of your disks.
grep -v Filesystem is to remove your header field for df -k command.

If you are looking for say a particular volume you could grep for it before awk.
For example you want to find the total allocated corresponding to a particular logical volume let say logVol1 you could use the following

ssh user@server df -k | grep logVol1| awk '{print $2}' | paste -sd+ | bc

If you want to do it on local server drop the ssh.

Thursday, October 17, 2013

Connecting to MS SQLServer from Linux using windows authentication , java and jtds

Download jtds from http://jtds.sourceforge.net

The following example connects to a SQLServer using windows authentication.
Source modified from "Here"

To compile the code use
$ javac testConnection.java

To run the code

$ java -cp ./jtds/jtds.jar:. testConnection

This assumes you have downloaded the jtds into a subfolder called jtds. Also in the code 1433 is the port of SQLServer.


 import java.sql.*;  
 public class testConnection  
 {  
   public static void main(String[] args)  
   {  
     DB db = new DB();   
     db.dbConnect("jdbc:jtds:sqlserver://<your SQL Server>:1433/<DatabaseName>;domain=<your Domain>","UserName","Password");  
   }  
 }  
 class DB  
 {  
   public DB() {}  
   public void dbConnect(String db_connect_string,  
  String db_userid, String db_password)  
   {  
     try  
     {  
       Class.forName("net.sourceforge.jtds.jdbc.Driver");  
       Connection conn = DriverManager.getConnection(  
   db_connect_string, db_userid, db_password);  
       System.out.println("connected");  
     }  
     catch (Exception e)  
     {  
       e.printStackTrace();  
     }  
   }  
 };  

Monday, July 15, 2013

My Journey in building a $400 Storage Server Part 1 (Hardware)

I have started thinking about making a $400 NAS server a very long back before the floods in Thaiwan and I planned to acquire the following items to build the server.

1. An ATX Cabinet
2. Some AMD processor with 2 cores
3. 3x 2TB drives
4. A Motherboard
5. 4GB of RAM
6. DVD Drive
7. Power Supply for the Cabinet.

I wanted to build every thing under $400 but with floods the cost of Hard Drives sky-rocketed and my project delayed. After thinking very hard I have decided that instead of sticking to just a storage server if I upgrade my desire to build a home all in one server which I can use as a Storage Server, Web Server, Email Server and File Share server then I can justify spending more for this project.

This is a list of hardware I purchased to build the server. In this part 1 I am going to document the building of the physical server and next parts I will write about what software / services I have installed on this server.

1. 3x 3TB Hard Drives from Amazon for $330

2. ATX Shinobi Cabinet from microcenter for $40

3. MSI Motherboard clearance from microcenter for $16
4. AMD FX 8320 CPU from microenter for $150

5. 500W Power supply from microcenter for $28

6.8GB Crucial memory from microcenter for $72
7. Some SATA III cables from microcenter for $10
8. Video card NVidia 8400 from microcenter for $25

Total Server cost $687 which is $287 above my planned budget. I hope this will turn into a good investment.

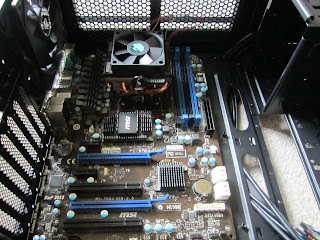
Here are some pictures of the build process.


Thursday, June 13, 2013

iptables Quick Reference

List current iptables

# iptables -L

To list in numeric form

# iptables -L -n

To include interface information too use verbose output

# iptables -L -n -v 

To append to a chain follow the example below

# iptables -A INPUT -s 10.1.10.1 -p tcp --dport 80 -j ACCEPT

To insert at say 7th position instead of Append

# iptables -I INPUT 7 -s 10.1.10.1 -p tcp --dport 80 -j ACCEPT

To save the iptables so that they survive reboots

# service iptables save

Saves every thing to /etc/sysconfig/iptables